


NYC AIRBNB MARKET ANALYSIS
OVERVIEW
Dive into the vibrant world of the NYC Airbnb Market Analysis Project, where we uncover the pulsating heartbeat of New York City's accommodation scene.
PURPOSE
Embark on an exhilarating journey to decode the secrets of NYC's Airbnb market, empowering stakeholders with the knowledge to shape the city's dynamic hospitality landscape.
OBJECTIVE
Illuminate Airbnb occupancy trends to empower staffing agencies in efficiently allocating resources, ensuring seamless service delivery amidst fluctuating accommodation demands.
Analysis Summary
-
Project took few weeks to complete due to cleaning the data and creating visualizations
-
Airbnb Booking Dataset
2021-2022 -
Excel
SQL
Python
Tableau
-
Data cleaning, descriptive analysis, aggregating data, data visualization and storytelling
Analytical Approach
-
Renaming and reformatting values for consistency and removing any duplicates.
-
Integrating the two data sets in order to create one data set for further analysis.
-
Discover the correlation between the population of New York City and the proportion of neighborhoods directly affected.
-
Hypothesis testing related to market trends, pricing strategies, regulatory impacts, and customer preferences likely played a significant role in the analysis.
-
Created charts and maps to provide insights of the data set and highlight the result of hypothesis testing.
Tebleau Story
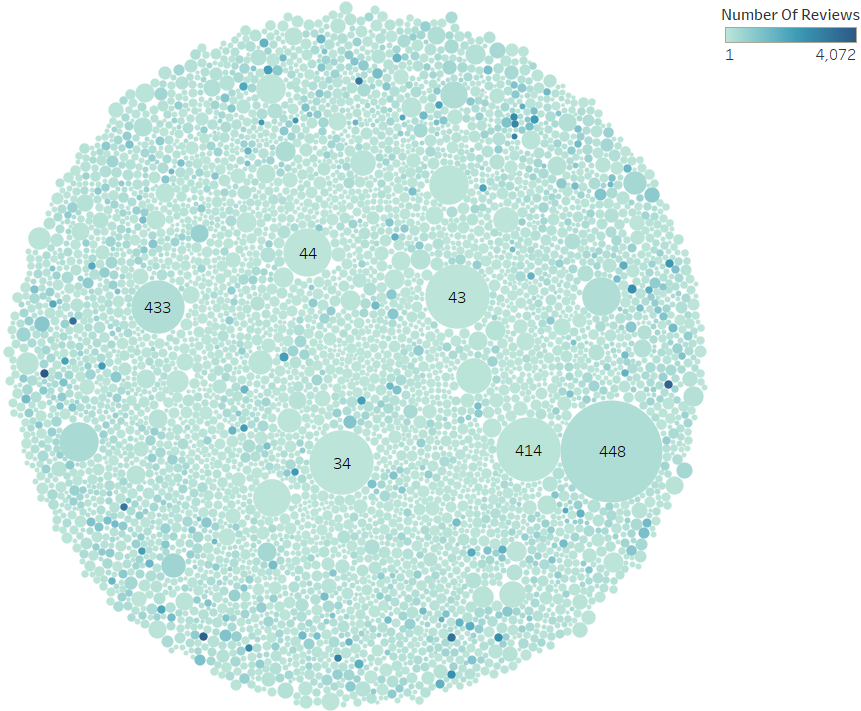
The scatter plot shows that neighborhoods with more Airbnb reviews tend to have higher prices, suggesting that popularity through reviews may influence pricing.
Data points are labeled by ratings and neighborhood, highlighting the impact of consumer feedback on Airbnb pricing strategies.
Results
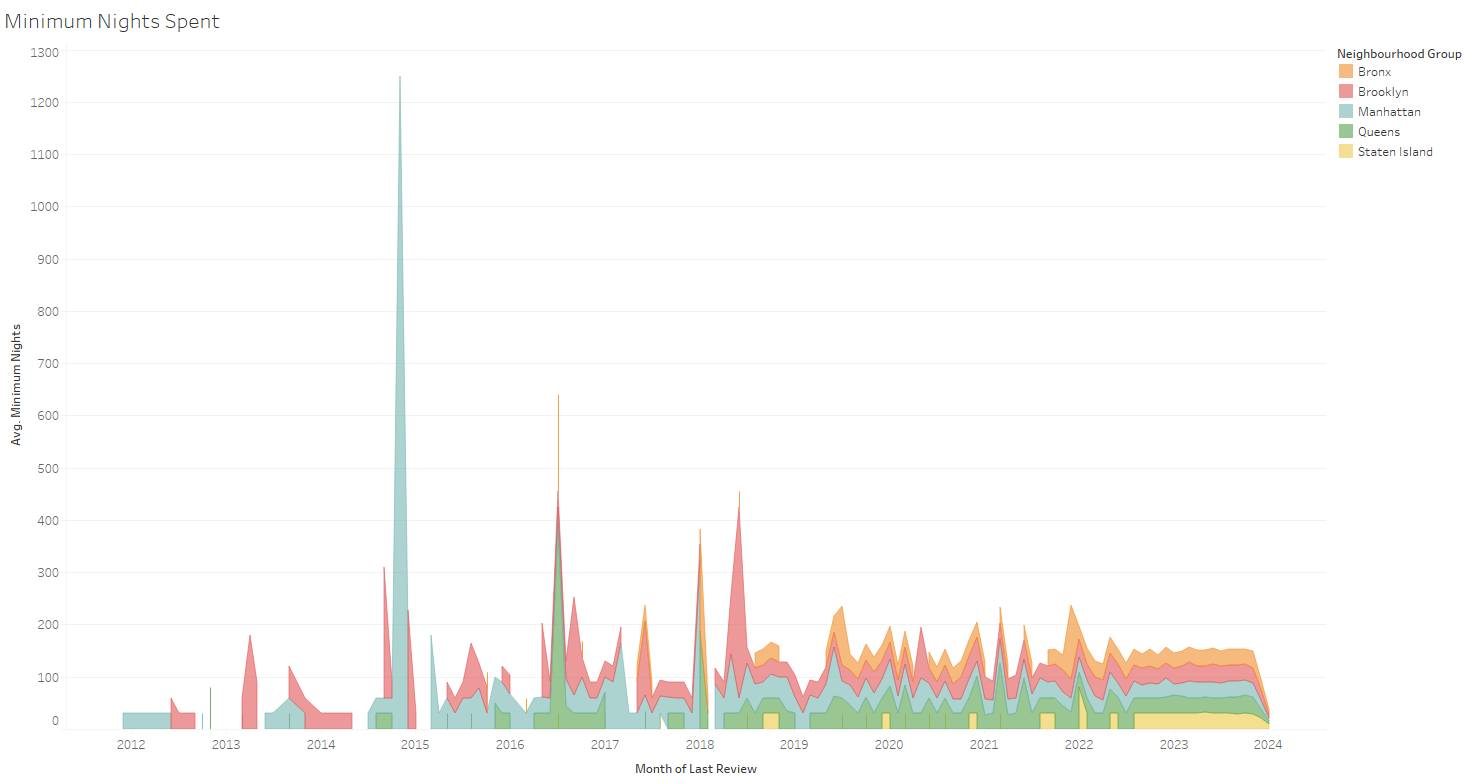
The average minimum nights spent in each of New York City's five boroughs, visualized through an area chart. The chart offers a clear comparison of accommodation preferences across neighborhoods over time, facilitating insights into tourism and urban trends.
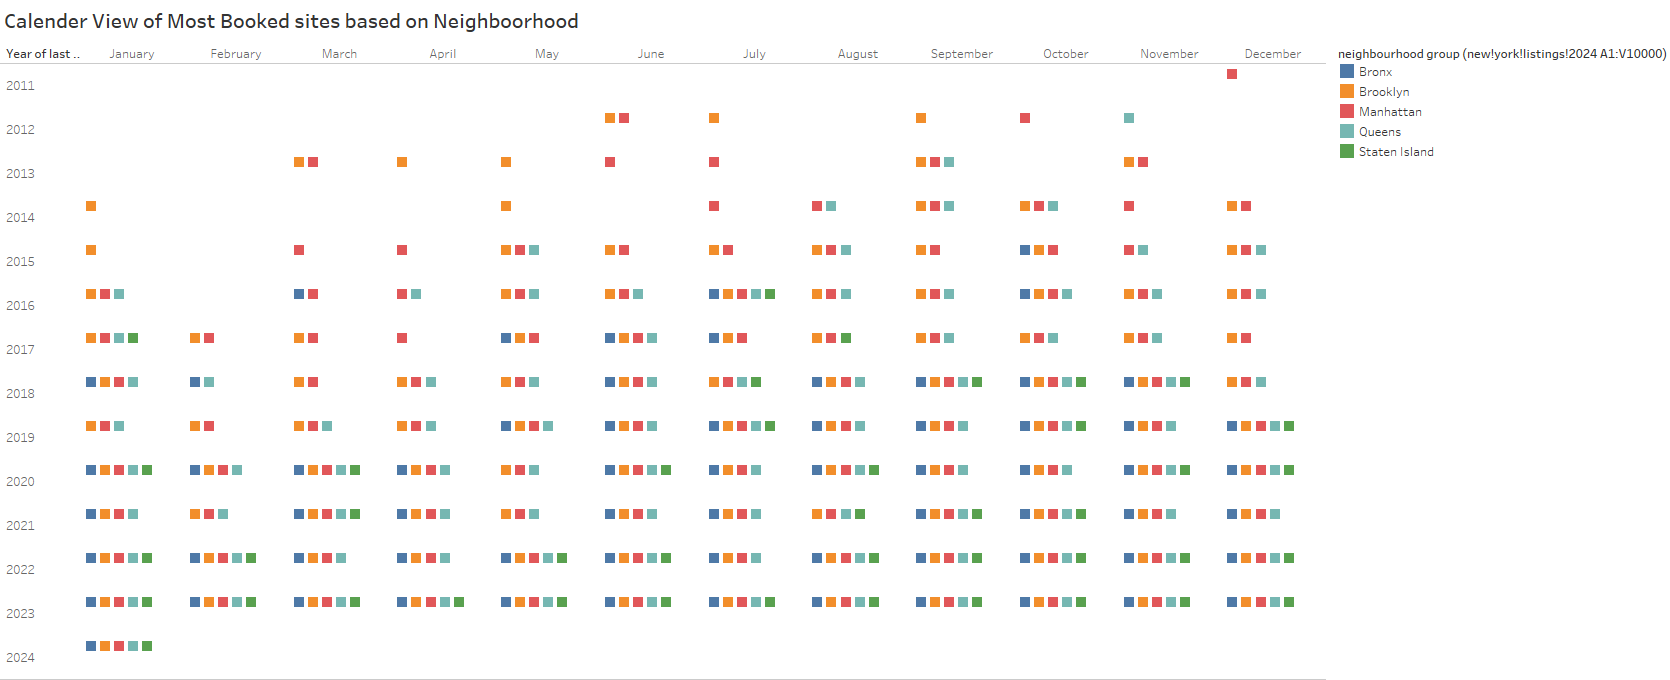
Bookings across NYC boroughs from 2021 to 2024, visually represented on a calendar: Bronx (Blue), Brooklyn (Orange), Manhattan (Red), Queens (Light Green), and Staten Island (Green).

Conclusion &
Recommendations
Limitations
To deliver excellent customer service and optimize profits, hosts should aim to locate their accommodations nearer to urban centers.
There is a common trend of hike in the usage of the platform during the duration of July– August.
The data set is missing most current values.
There was no data in regard to staffing availabilities, so no further suggestions can be made on appropriate staffing distribution.